Oil prices continued to rise through the beginning of July as average gasoline prices climbed to 7-year highs. The theme of the month was “What would OPEC+ do?” to either further the price increases or help pull them back, as demand continues to grow, and supply gets tighter. The following graph shows the daily price movements over the past three months:
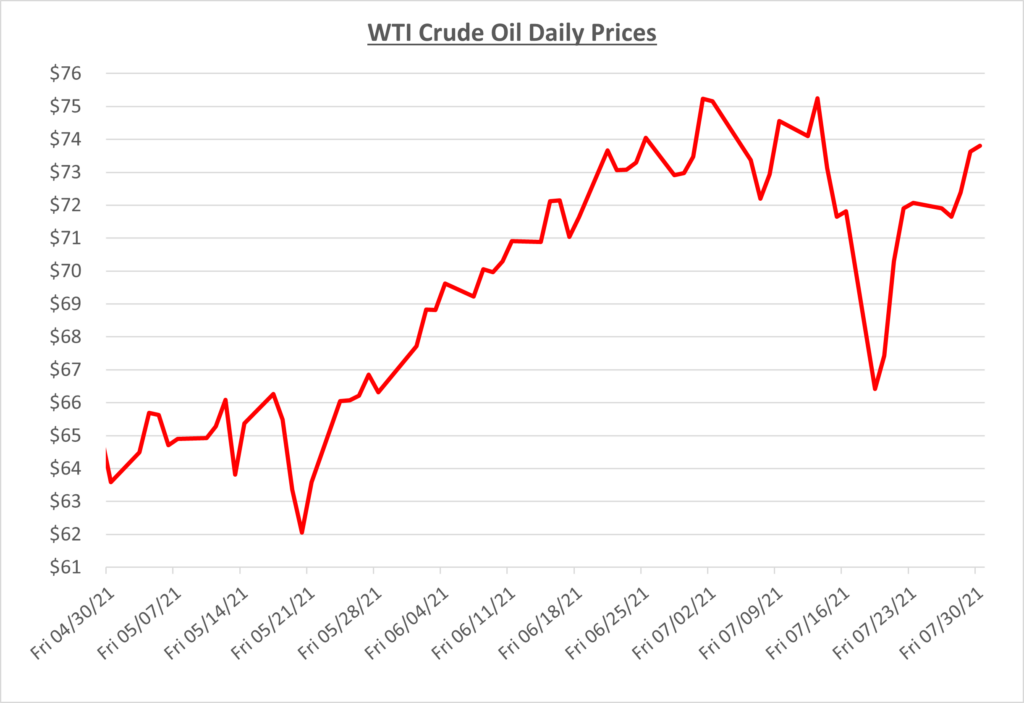
After the first week of July where oil hit $75/barrel, prices began to fall as OPEC+ canceled their initial meeting. Over the next two weeks, the market experienced significant volatility, as many were expecting they would come to an agreement to gradually increase output. With no real plan in place, it caused uncertainty. Prices could climb if they gradually increased production, but if OPEC+ were to fall apart, the market could flood with supply and cause prices to drop.
During the second half of the month, oil dipped as low as $66/barrel, because of the uncertainty as well as the surging Delta variant causing fear globally. Then, positive news started to surface about the UAE and Saudi Arabia coming to an agreement on easing supply back into the market for the rest of 2021. OPEC+ finally reached a deal on July 18th to increase production by 400,000 barrels/day beginning in August. This will add roughly 2% to world supply by the end of the calendar year.
The graphs below show the movement of crude oil (converted to gallons) along with wholesale and retail fuel prices over the trailing 15 months:
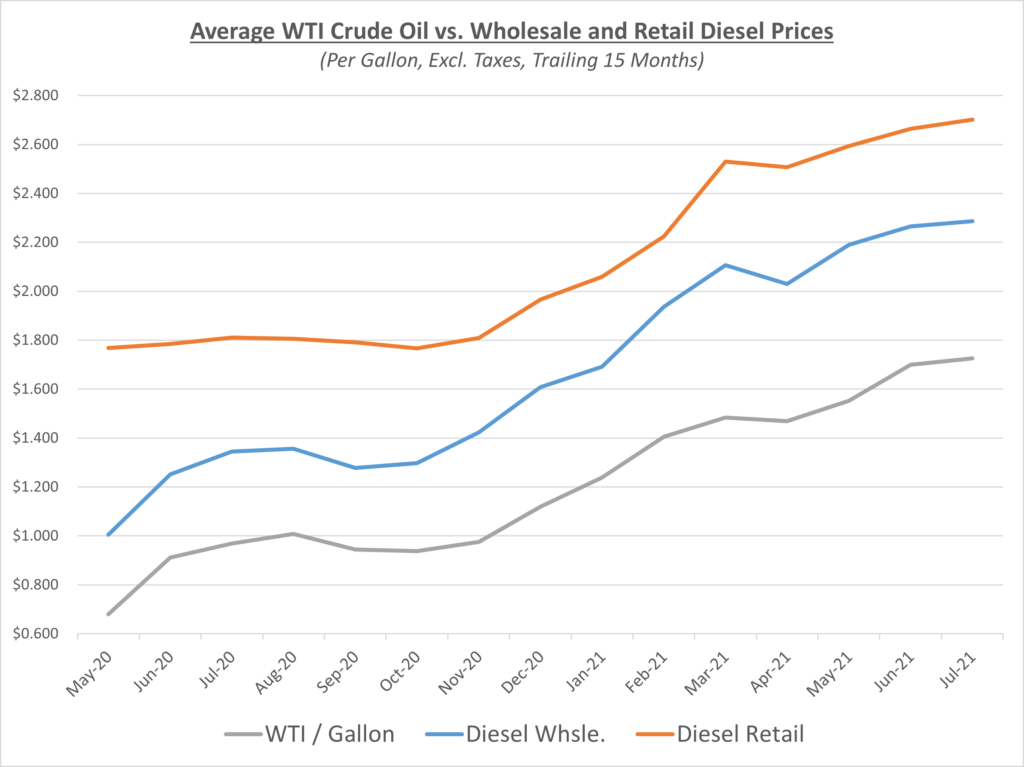
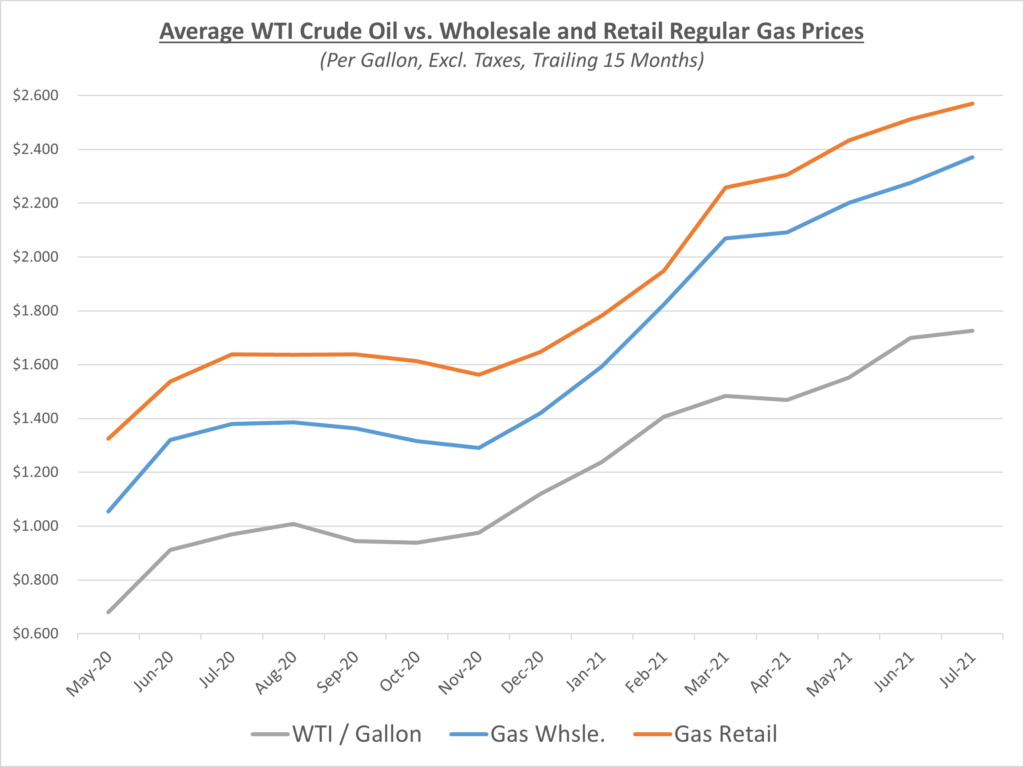
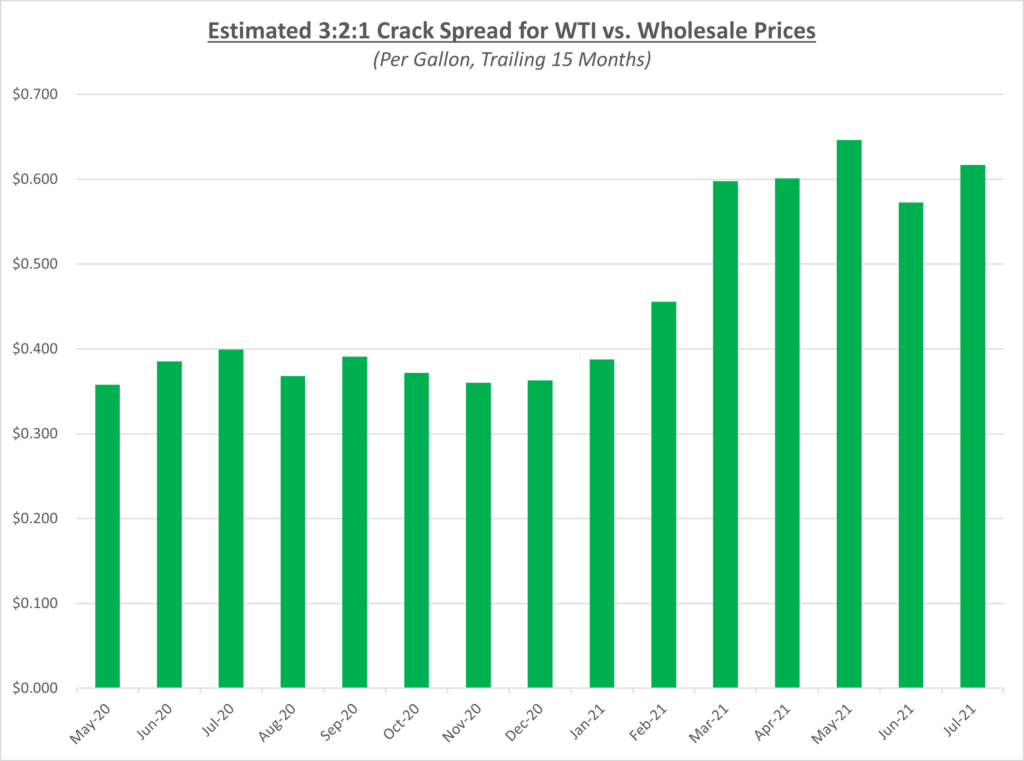
Last month reflected a decrease in refined fuel prices versus oil based on the 3-2-1 crack spread trends which may have suggested a decline back to more normal levels. However, that wasn’t the case as July saw the spread increase and end up being the 2nd highest month over the past 15 months as shown in the 3-2-1 crack spread graph below. As a refresher, the 3-2-1 crack spread is based on a rough calculation that three barrels of oil can be refined into two barrels of gas and one barrel of diesel fuel. Demand for refined fuels continues to be high while supplies are tight which has kept the spread at high levels.
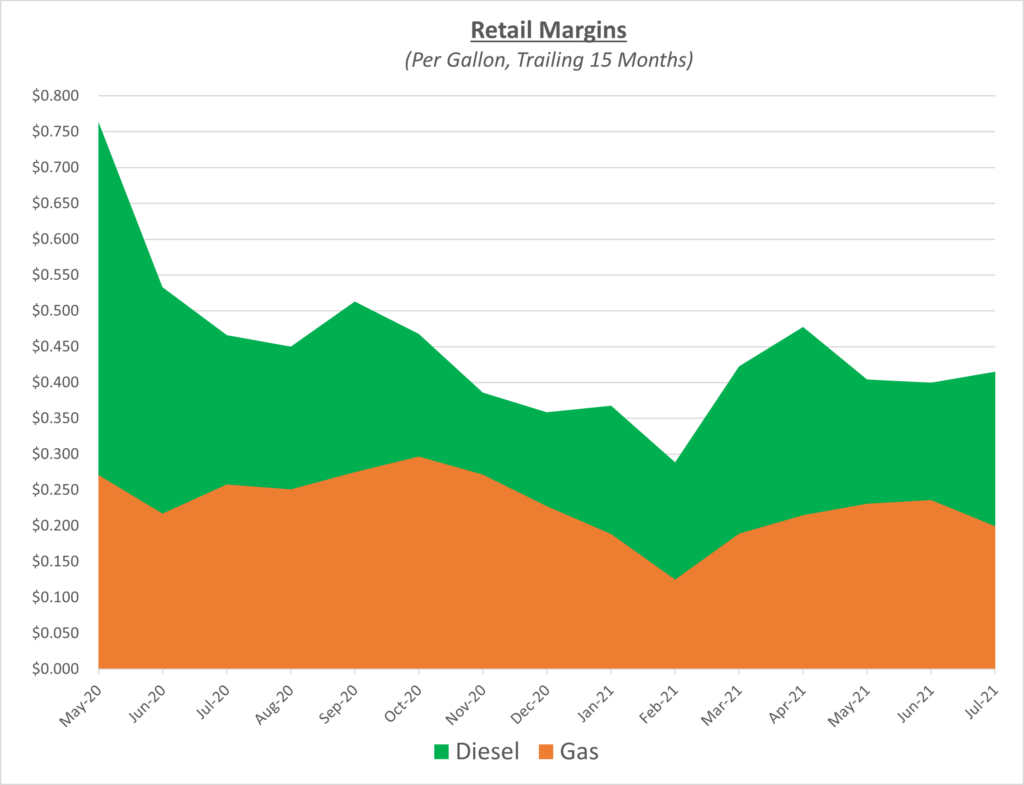
Diesel and gas retail margins went in opposite directions in July. Diesel margins increased while gas decreased. With the significant drop in oil prices mid-month, diesel margins benefited from stations holding onto their higher prices instead of adjusting down with the market. The following graph shows the retail margins over the trailing 15 months:
Oil started July at $73/barrel and finished at the same level despite a turbulent month. Even with the OPEC+ agreement to increase supply throughout the year and the Delta variant causing havoc globally, prices could not be held down. Sokolis sees oil continuing to hover in $70s, with some likelihood of breaking through the $80 mark, by the end of the year. Two additional factors to consider supporting higher prices are the driver shortage and recent state tax increases.
The driver shortage has been a problem in the transportation industry for years, but this past year it has especially been hard on fuel carriers. There are more qualifications needed to drive a fuel truck (Hazmat, CDL, etc.) and drivers have the leverage in what jobs they want to take. This is causing companies to pay more to ensure they obtain drivers, and they’re passing that cost along to the consumer at the pump or on your on-site delivery.
We have also seen many increases in state taxes this month, which is not uncommon at the beginning of each calendar quarter. State taxes frequently increase throughout the year as additional funds are needed to maintain and expand infrastructure. Even if the underlying price of oil were flat, increases in taxes would still cause refined product prices to rise.