Fuel Procurement: A Quick Guide to Success
Buying fuel can be confusing. Discover the best practices and technologies that can help you buy fuel at a low cost.
Buying fuel can be confusing. Discover the best practices and technologies that can help you buy fuel at a low cost.

Discover how biodiesel fuel can help you reduce emissions, save money and reach your sustainability goals.
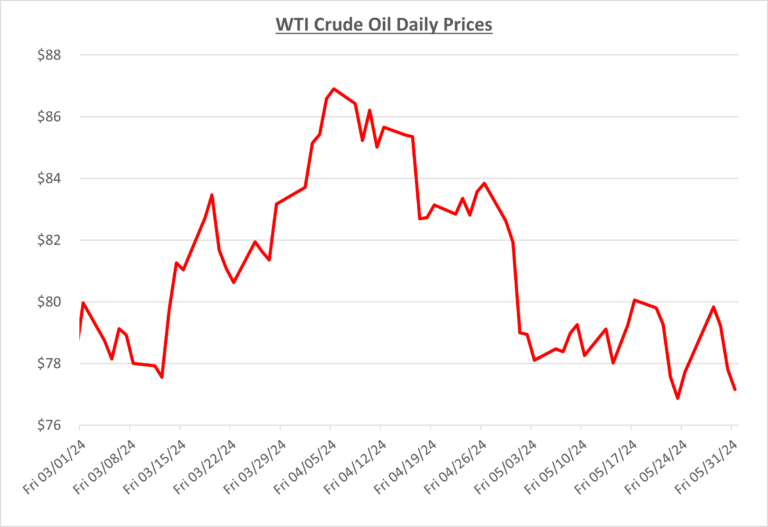
Oil prices continued their downward trend from April into May as they fell below $80/barrel. Easing tensions in the Middle East and the Federal Reserve keeping interest rates steady instead of cutting them are some factors contributing to bearish sentiment in the market. The following graph shows the daily price movements over the past three months: Positive economic news for

Discover how biodiesel fuel can help you reduce emissions, save money and reach your sustainability goals.

Learn how to avoid three costly mistakes when buying fuel in bulk, from ignoring fuel data to focusing on the price.
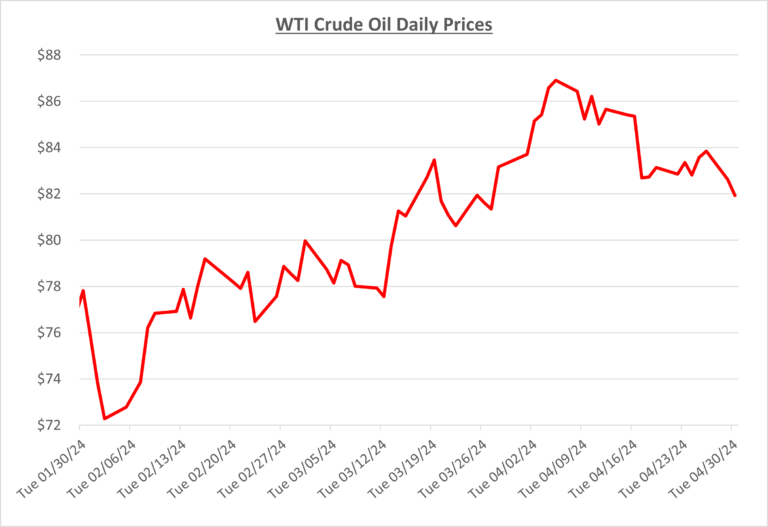
Oil prices started April with a big spike as they quickly approached the mid-$80s per barrel. With U.S. inventories showing draws and continued turmoil in Russia/Ukraine as well as the Middle East, prices were forced to go up with uncertainty surrounding oil. The following graph shows the daily price movements over the past three months: After hitting just under $87/barrel,

Efficient fuel programs help businesses save money, comply with regulations, and stay competitive. To improve your fuel program, you should understand market trends, as well as set clear goals for your organization.
As most oil analysts expected, it’s being reported that OPEC+ has decided to continue production cuts for at least another three months. Oil began March in the upper $70s per barrel as the market seemed to have already priced in this potential outcome. Global demand and supply seemed to be at a stalemate, causing oil prices to be steady for
Oil prices began February heading toward the lower $70s per barrel, after finally spending some time above the mid-$70 mark to end January. Some positive news about the possible ceasefire in Gaza helped cool prices down early in February, but that would be short lived. The following graph shows the daily price movements over the past three months: By mid-month,
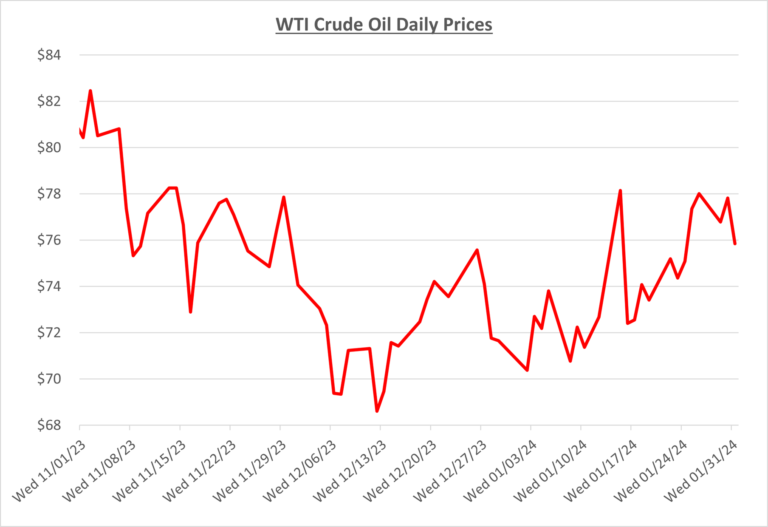
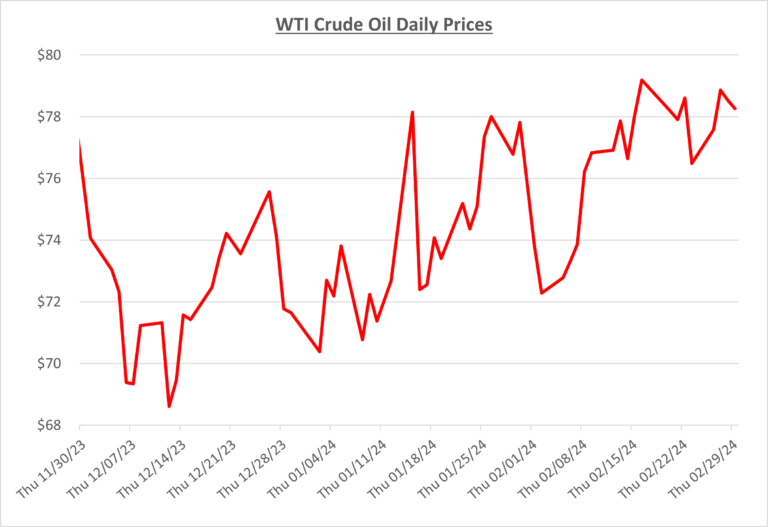
Oil prices remained in the low $70’s per barrel during the turn from 2023 to 2024. Even with things remaining volatile in the Middle East, weak demand and strong supply continue to overpower the market’s concern for global conflicts. The following graph shows the daily price movements over the past three months: By mid-month, the conflict in the Middle East
