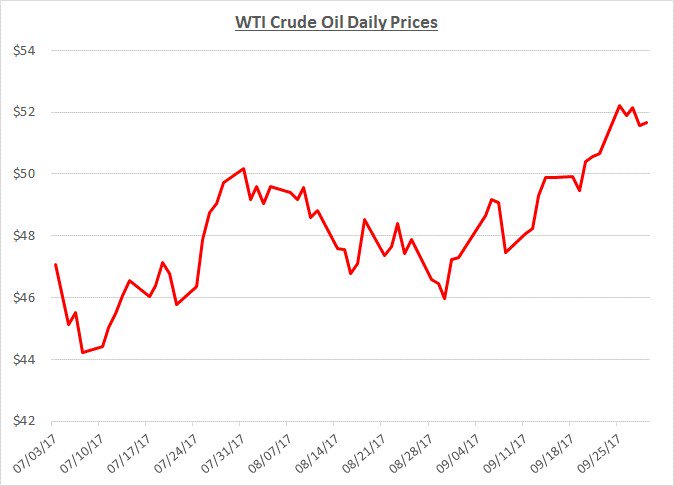
Crude oil prices increased by approximately 10% throughout September. They started at just over $47/barrel and closed the month near $52. The following graph shows the daily price movements over the past three months:

The increase in crude oil prices was partially driven by strong demand to produce refined products in the aftermath of Hurricanes Harvey and Irma. Prices were also supported by bullish reports that OPEC was considering further reductions in production to help reduce global oil inventories. In addition, further support was provided by a decline in the number of US production rigs which could lead to reduced inventory supplies in the future.
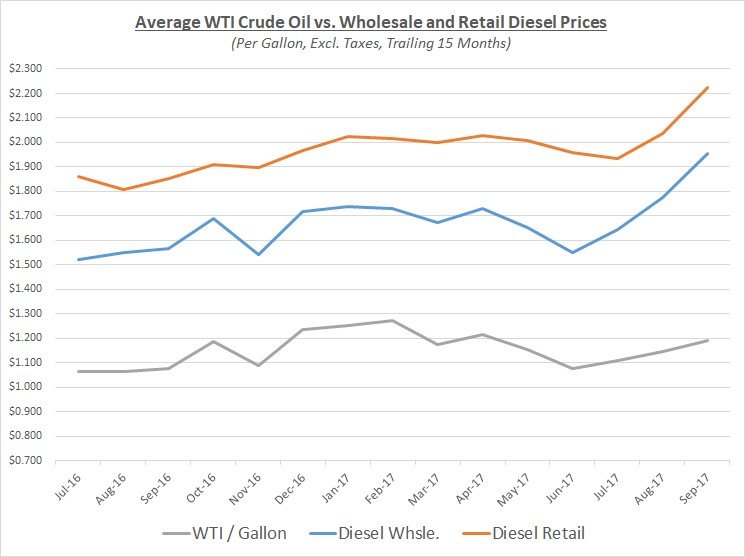
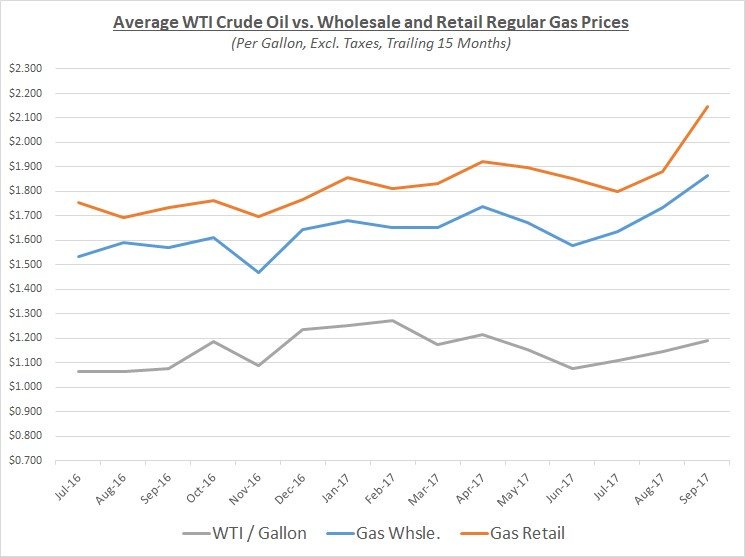
As oil prices modestly increased during September, diesel and gas prices rose sharply. The increase for these products was primarily due to the hurricanes which caused significant disruptions to refining and distribution operations in Texas and Florida. Severe product shortages were experienced in these states along with some areas in the Southeast and Mid-Atlantic regions of the US. Many other regions throughout the country also felt a ripple effect of increasing prices as distributors reallocated their resources to focus on the severely impacted areas. The graphs below show the movement of crude oil (converted to gallons) along with wholesale and retail fuel prices over the trailing 15 months:


The graphs above show September’s wholesale and retail prices reached their highest level over the trailing 15 months. Looking prior to that period, fuel prices had not been this high since the summer of 2015.
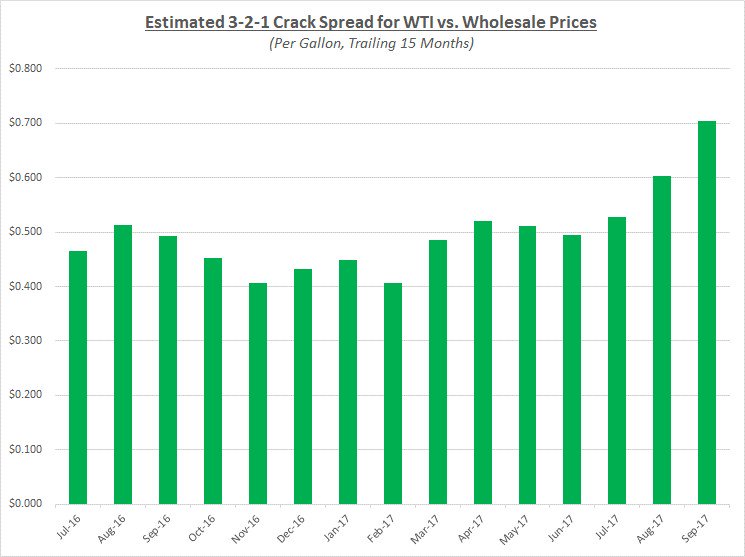
Another interesting change reflected in these graphs is the significant increase in the spread between crude oil versus wholesale and retail prices. As mentioned above, crude oil prices moved up by a modest amount while refined products were sharply higher due to disruptions from the hurricanes. The difference in crude versus refined product prices is referred to as the “crack spread” in the petroleum industry. This metric is often calculated as a 3-2-1 ratio based on the assumption that three barrels of crude oil can be refined (processed through the cracking unit) into two barrels of gas and one barrel of diesel. The following graph shows the estimated 3-2-1 crack spread over the last 15 months:

Refiners will attempt to take advantage of the above average crack spread for an extended period but this high level is typically not sustained for long stretches of time. Prices for diesel and gas could begin to subside over the next couple months as the crack spread normalizes assuming there are no further increases in the underlying price of crude oil.
Looking beyond September, Sokolis anticipates crude oil prices will continue to hover in the low- to mid-$50’s/barrel for the remainder of the year. There is some potential for prices to climb higher if the post-hurricane demand continues while demand grows for heating oil during the approaching colder months.
If you’re concerned about the impact of future fuel price changes for your fleet and want to know if you’re receiving the best fuel prices possible, contact Conor Proud at Sokolis, [email protected] or 267-482-6159. We are the nation’s leading independent fuel management consulting team and can help you make sure that your fuel management program is running at peak efficiency.